

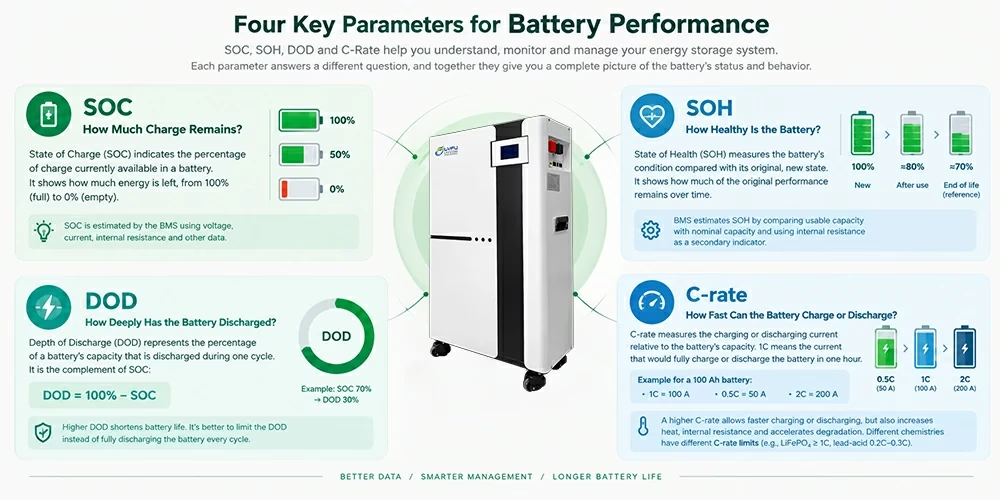
Energy storage systems and battery management systems (BMS) rely on four key parameters: State of Charge (SOC), State of Health (SOH), Depth of Discharge (DOD), and C-rate. Each parameter answers a different question: How much charge remains? How healthy is the battery? How deeply has it discharged? How quickly can it charge or discharge?
Together, these four measurements help engineers interpret battery datasheets, evaluate operating conditions, and manage battery performance. The following sections explain what each parameter means and why it matters.
SOC: How Much Charge Remains?
State of Charge (SOC) indicates the percentage of charge currently available in a battery. Like the battery icon on a mobile phone, an SOC of 100% represents a fully charged battery, while an SOC of 0% represents a fully depleted battery.
However, the BMS cannot measure SOC directly. It can measure voltage and current, but it must estimate the remaining charge by combining voltage readings, current integration, internal resistance, and other data. For this reason, SOC estimation accuracy remains an important BMS performance indicator. If the system estimates SOC inaccurately, the display might show 30% before the battery suddenly reaches 0%.
In short, SOC tells you how much charge remains, expressed as a percentage.
SOH: How Healthy Is the Battery?
State of Health (SOH) measures a battery’s condition compared with its original, new condition. It answers a longer-term question: after years of operation, how much of the battery’s original performance remains?
Manufacturers usually express SOH as a percentage. A new battery starts at 100% SOH. As the battery completes more cycles, its internal resistance increases and its capacity declines. Consequently, its SOH gradually decreases.
The industry often uses an SOH of approximately 70% as a reference point for the end of a battery’s useful life. This threshold does not mean the battery can no longer operate. Instead, it indicates that the battery has experienced a noticeable decline in capacity and performance and may no longer suit its original application.
BMS algorithms typically estimate SOH by comparing the battery’s actual usable capacity with its nominal capacity. They may also use changes in internal resistance as a secondary indicator.
In short, SOH tells you how much the battery has aged.
DOD: How Deeply Has the Battery Discharged?
Depth of Discharge (DOD) represents the percentage of a battery’s capacity that the system discharges during one cycle. DOD complements SOC according to the following formula:
DOD = 100% − SOC
For example, if the battery’s SOC is 70%, its DOD is 30%. As the system discharges more energy, the DOD increases.
DOD matters because it directly affects battery life. For example, a lead-acid battery discharged to 80% DOD during every cycle may last only a few hundred cycles. If the system limits the DOD to 50%, the battery’s cycle life may double or increase even further. Lithium batteries generally tolerate deeper discharge better than lead-acid batteries, but consistently high DOD still accelerates degradation.
Therefore, system designers should actively limit DOD rather than allow the battery to discharge completely during every cycle.
In short, DOD tells you how much energy the battery discharged during a cycle; deeper discharge generally shortens battery life.
C-Rate: How Fast Can the Battery Charge or Discharge?
C-rate measures the charging or discharging current relative to the battery’s capacity. A rate of 1C represents the current that would fully discharge a battery in one hour or fully charge it in one hour under the specified conditions.
For a 100 Ah battery:
- 1C = 100 A
- 0.5C = 50 A
- 2C = 200 A
C-rate affects both operating speed and battery stress. A higher C-rate allows faster charging or discharging, but it also places greater stress on the battery. High-rate operation generates more heat, increases internal resistance more quickly, and accelerates capacity loss.
Battery chemistries also respond differently to high C-rates. LiFePO₄ batteries can typically support a continuous discharge rate of 1C or higher, depending on the product design. Lead-acid batteries, by contrast, generally perform best within a lower range of approximately 0.2C to 0.3C.
In an energy storage system, C-rate also determines whether the battery can handle a high-power load. For example, an inverter may need to supply a 5 kW load while the battery bank can discharge only at 0.5C. In that case, the battery may not deliver the required power instantly, regardless of its total capacity.
In short, C-rate tells you how quickly the battery can charge or discharge; 1C represents a full charge or discharge in approximately one hour.
Four Parameters, Four Perspectives
When viewed together, SOC, SOH, DOD, and C-rate describe different aspects of battery operation:
| Parameter | Full Name | Question It Answers | Plain-Language Meaning |
| SOC | State of Charge | How much charge remains now? | Battery charge percentage |
| SOH | State of Health | How healthy is the battery? | Degree of aging |
| DOD | Depth of Discharge | How much did the battery discharge during this cycle? | Discharge depth |
| C-rate | C-rate | How quickly can the battery charge or discharge? | Charge or discharge speed |
Ultimately, SOC describes the battery’s current condition, SOH tracks its long-term health, DOD measures single-cycle discharge behavior, and C-rate reflects charging and discharging intensity. By monitoring all four parameters together, BMS and energy storage systems can manage battery performance more effectively, support safer operation, and improve system design decisions.
